Impact & Reach: Executive Summary
At the start of the RCCPII Capacity Development Inititive in January 2019, the project team developed a Theory of Change Model to plan specific interventions. The aim was to provide capacity development opportunities for the following categories of people:
- IT staff (specifically those involved in providing internet access at universities)
- Teaching and Learning, as well as Research Support staff (including the broader IT staff complement, libraries, research offices, university administrators, teaching and learning professionals, etc.)
- Internet users (in this context referring to the people at universities who drive internet usage including students, researchers, and lecturers).
We also aimed to provide a large number of opportunities for these groups of people to attend RCCPII activities together to learn about each others’ worlds and build bridges between support and end users.
Activities
The RCCPII Capacity Development Initiative hosted 47 activities in 15 months. The programme included 21 online and 25 in-person activities and reached 775 individuals. Since several participants joined more than one activity a total of 1,180 participants took part across the full programme.
The map below shows the spread of activities across South Africa. 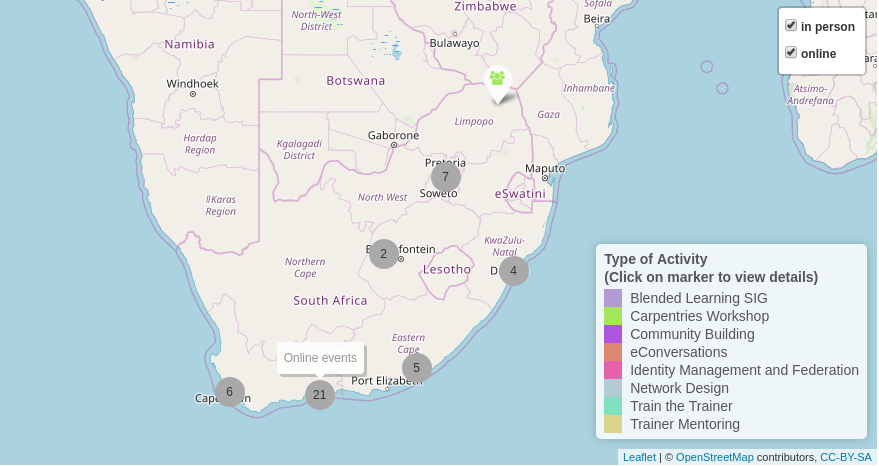
| Activity Type | Number of Activities | Number of SA Public Universities Reached | Number of Participants |
|---|---|---|---|
| Blended Learning SIG | 2 | 16 | 63 |
| Digital & Computational (Carpentries) Workshops | 14 | 25 | 558 |
| Community Building | 4 | 9 | 96 |
| eConversations | 7 | 14 | 133 |
| Identity Management & Federation | 1 | 15 | 31 |
| Network Design | 1 | 11 | 25 |
| Train the Trainer | 3 | 19 | 98 |
| Trainer Mentoring | 14 | 13 | 176 |
Other publicly funded institutions also benefited from the programme, including research councils and research organisations.
Beneficiaries
As mentioned above, the RCCPII capacity development initiative reached 775 individuals with several participants taking part in more than one activity. Over the 15 months we had 81 people acting as instructors and 30 acting as helpers. Some people instructed several times.
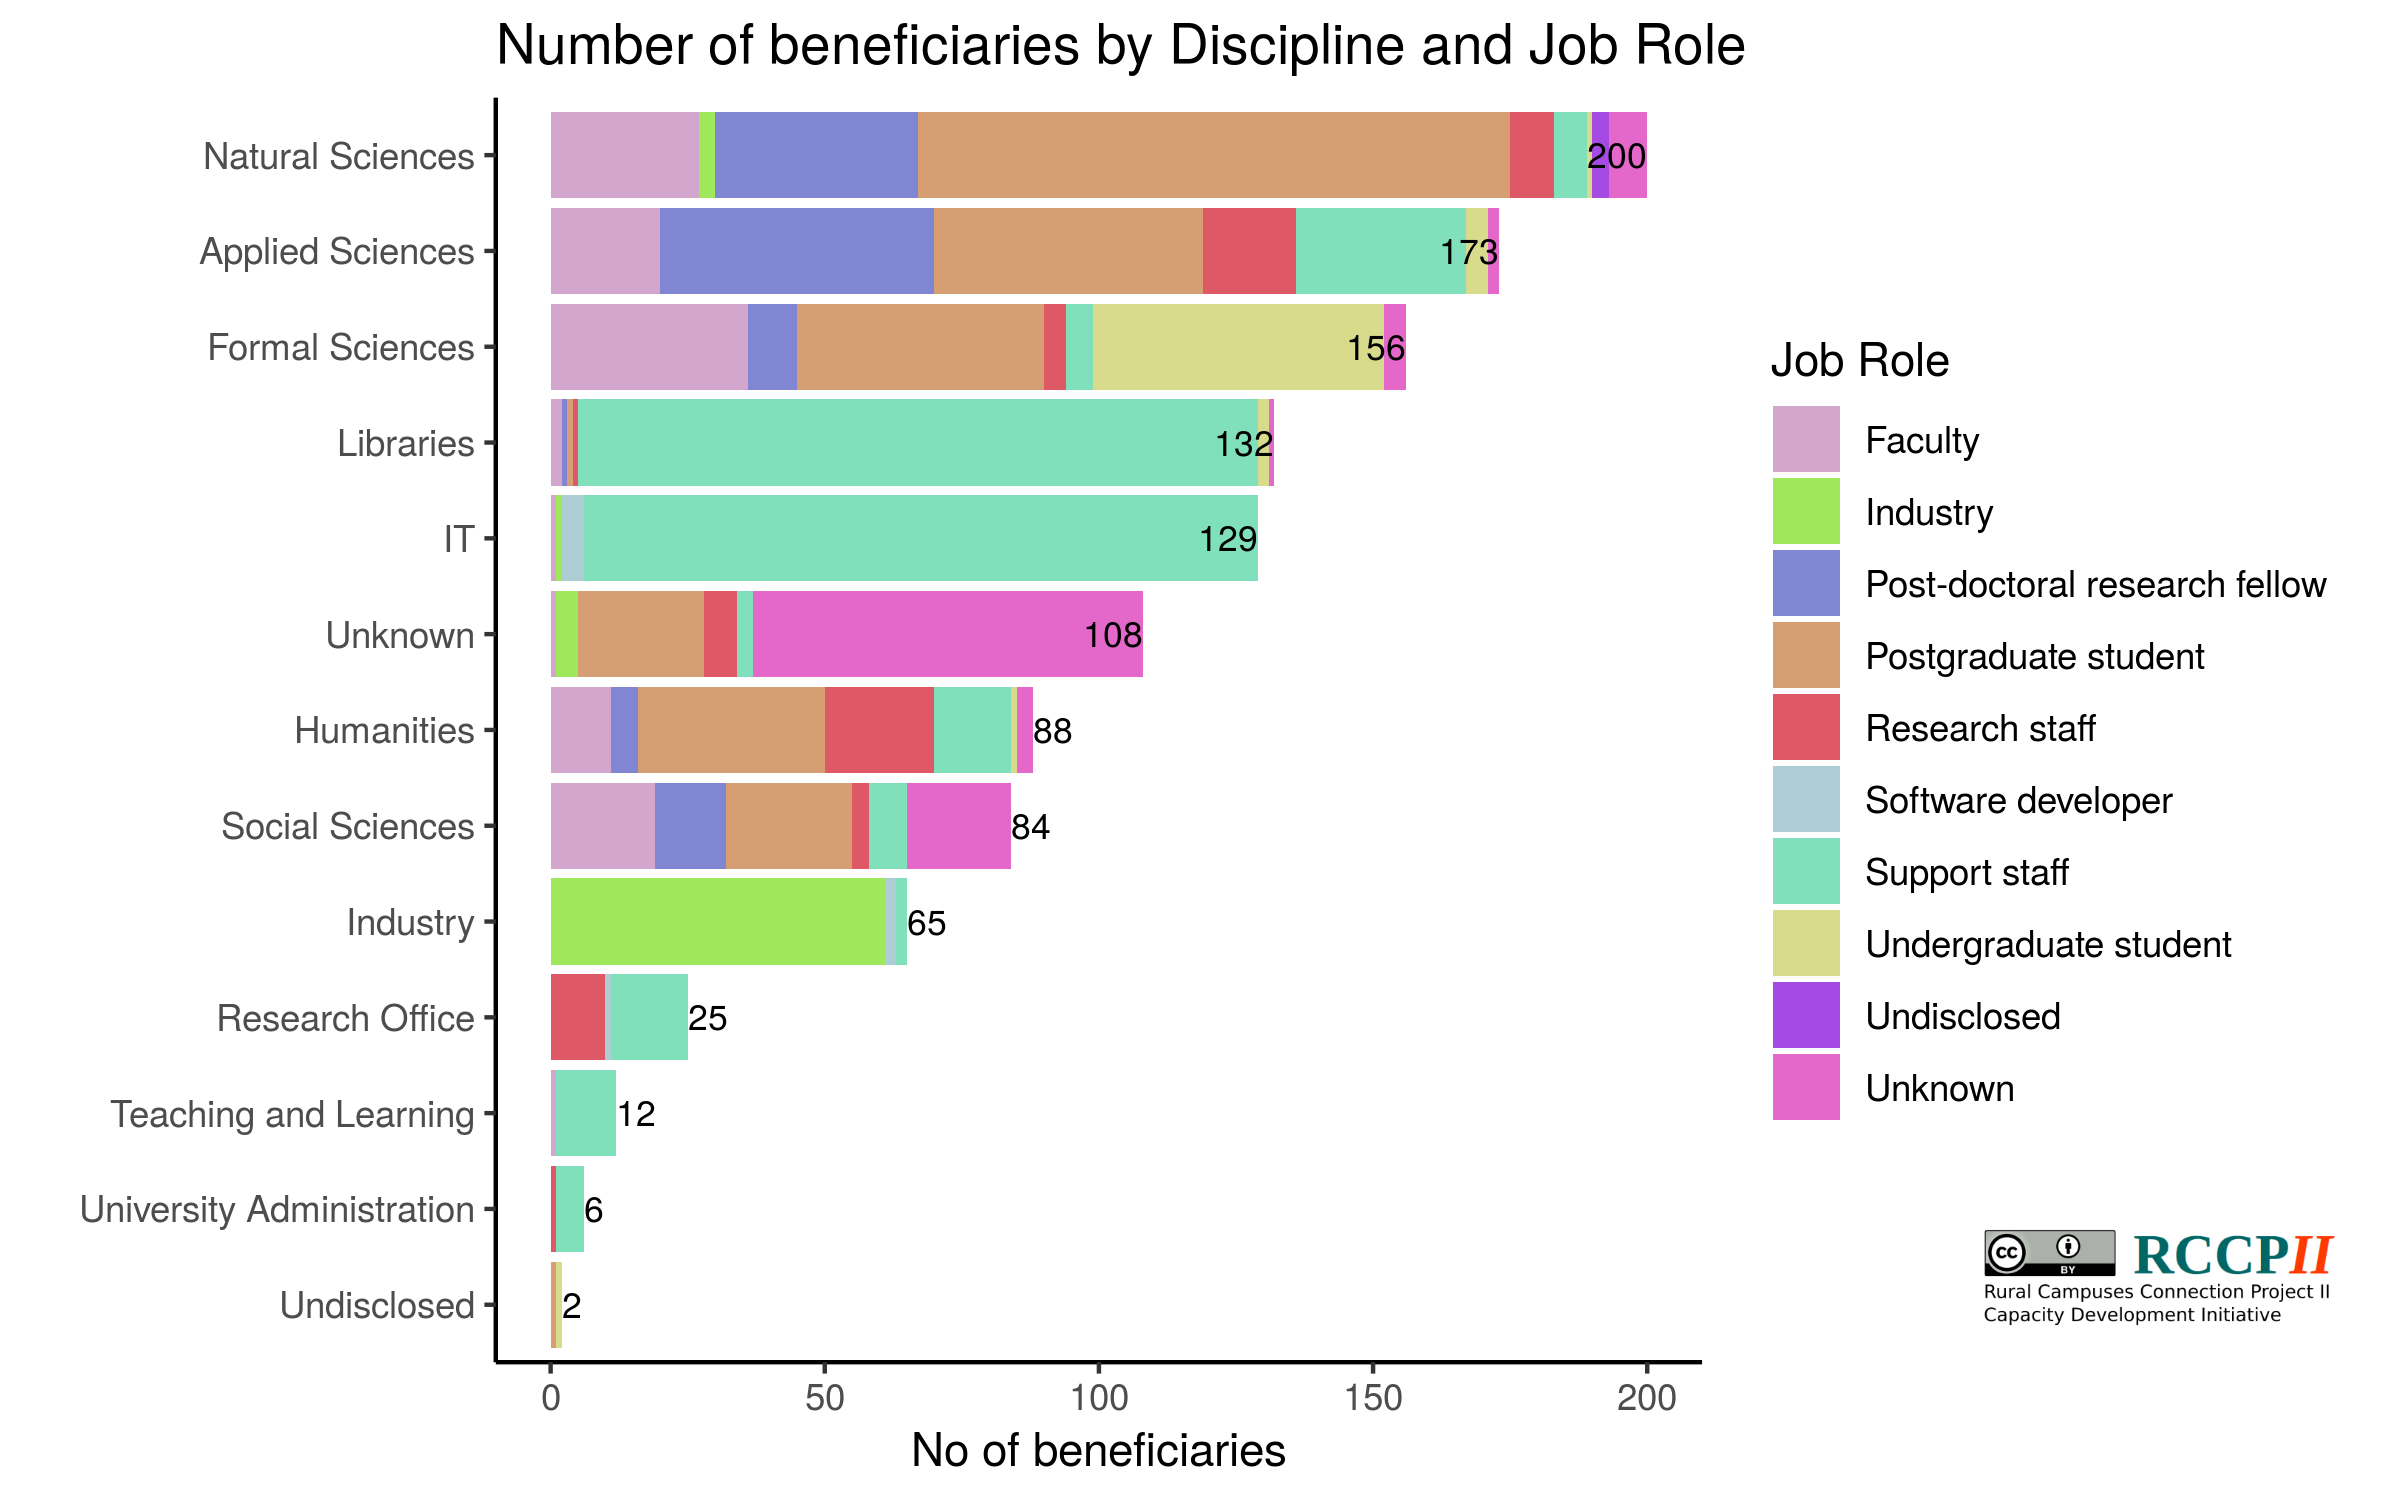
The plot below (downloaded from the RCCPII Shiny App) shows the diversity in participants’ disciplines as well as their job role at the time of the activity.
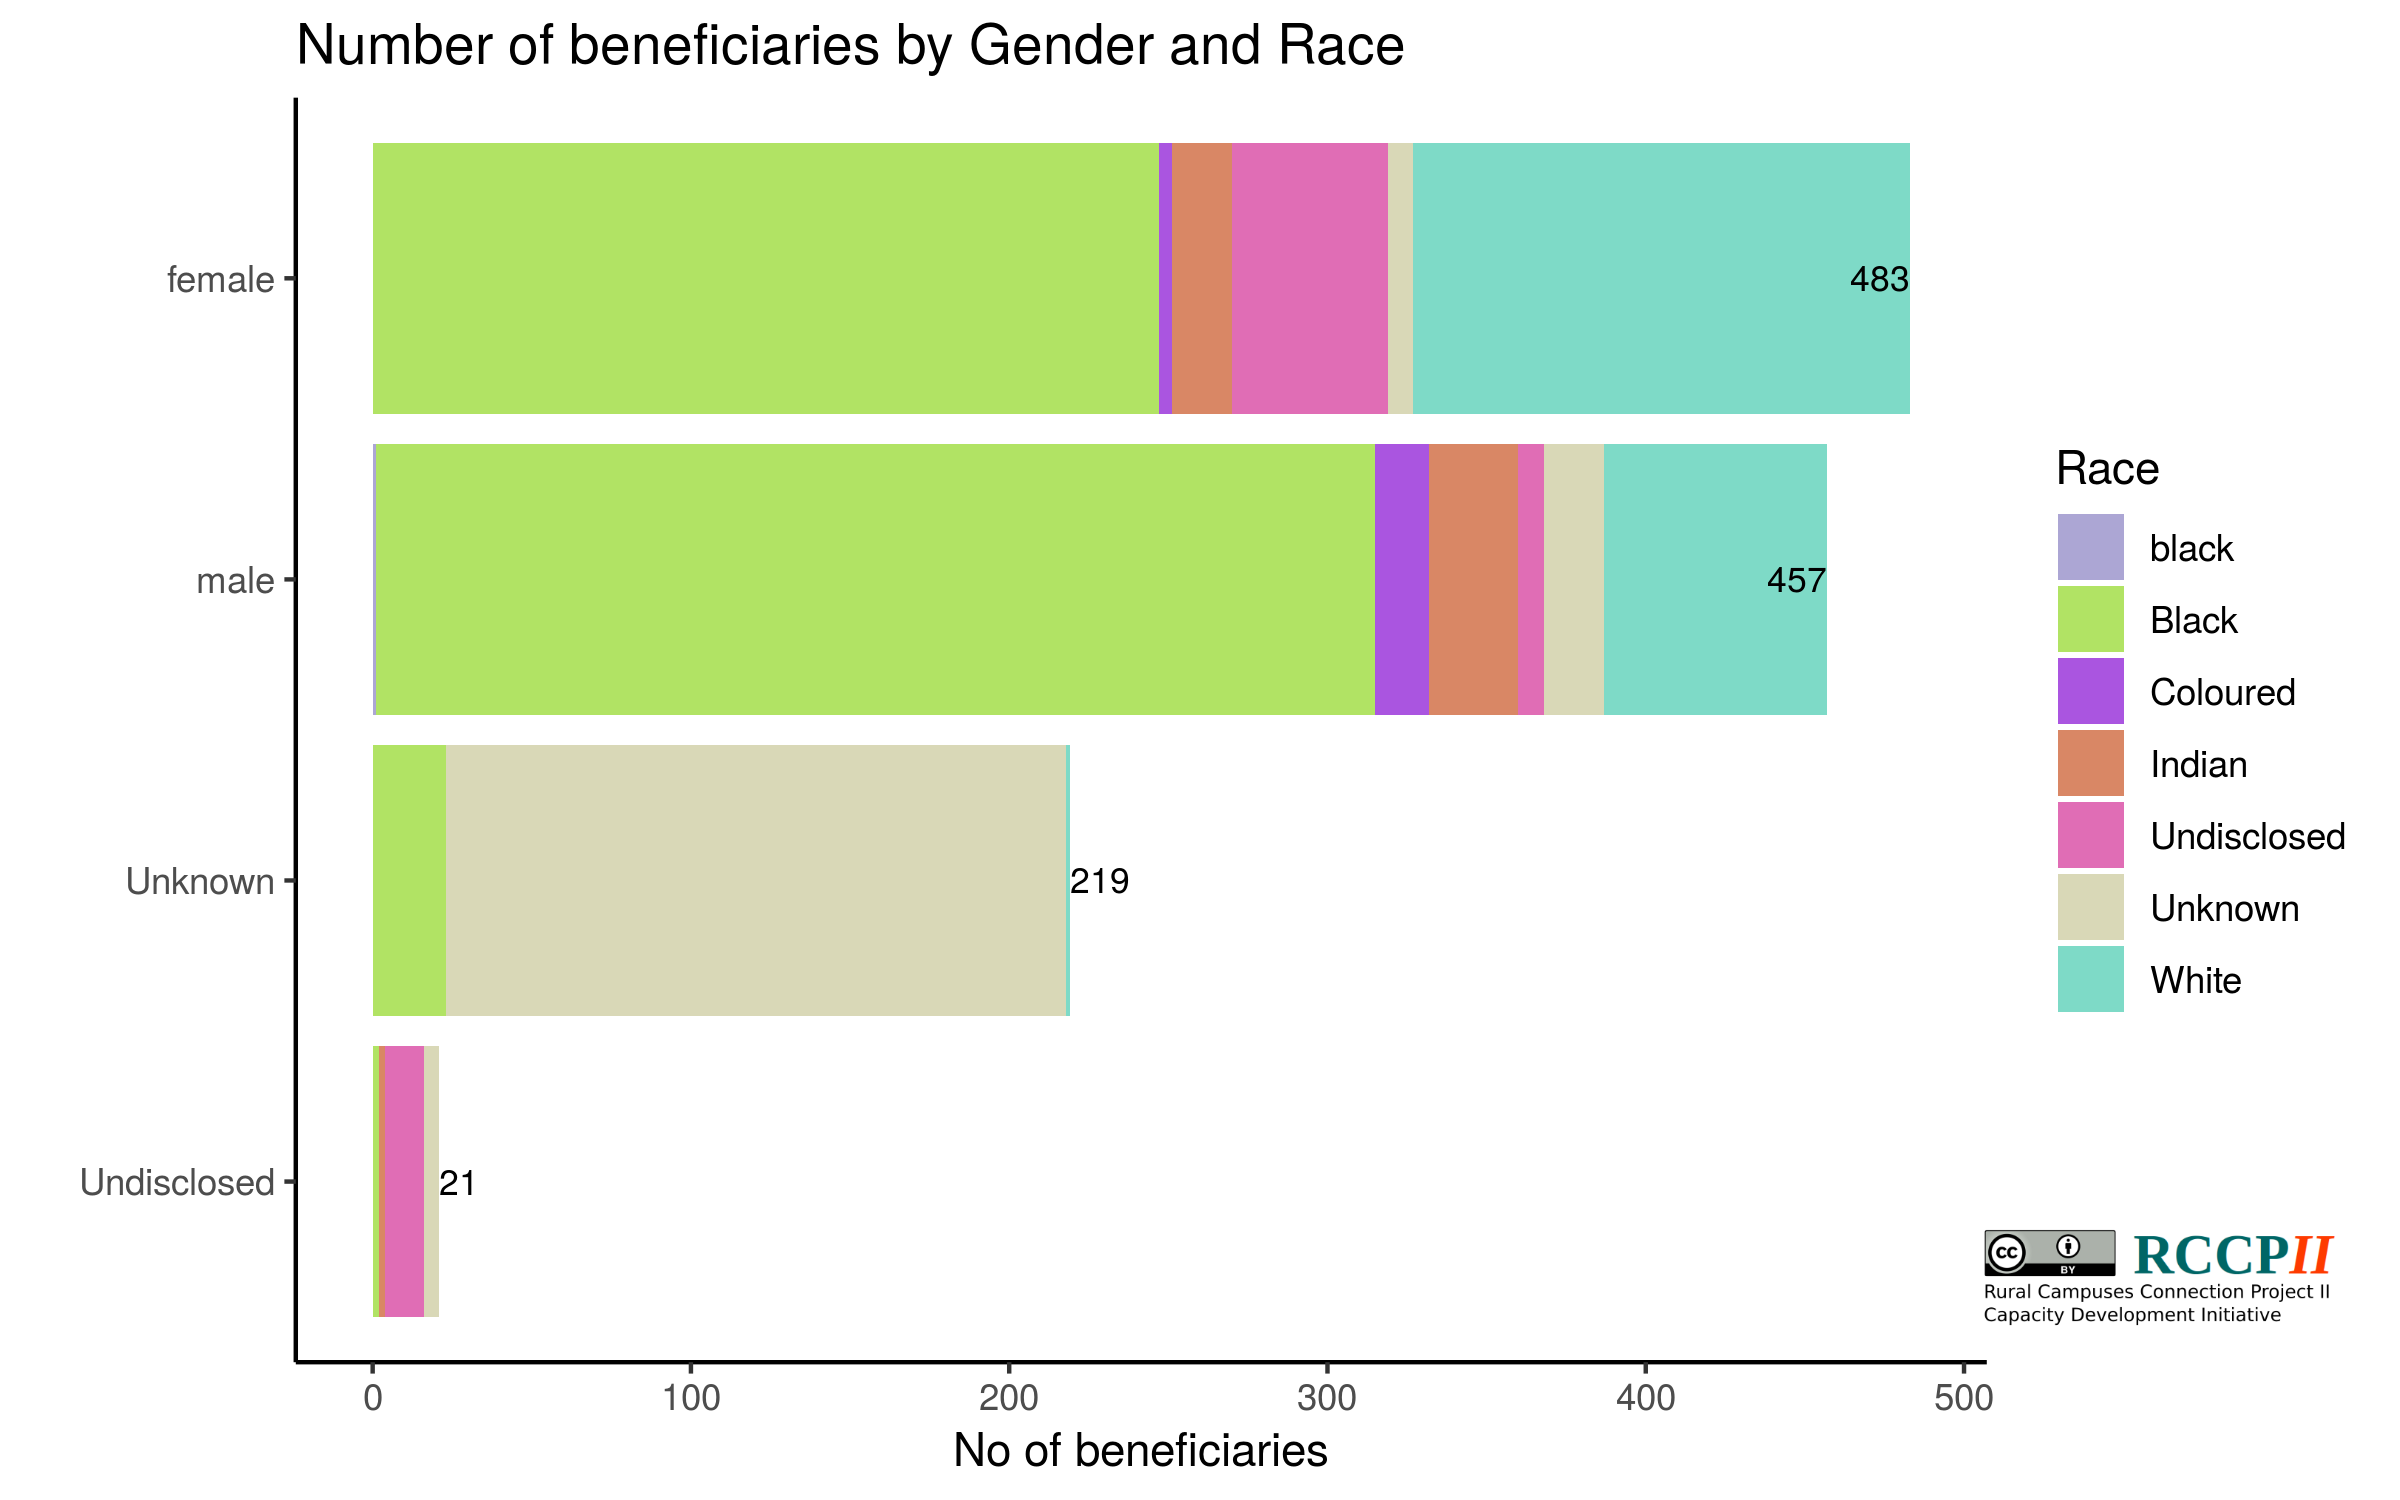
The RCCPII capacity development initiative team set out from the start, with the vision of making the activities accessible to the broadest possible contingent of South African students (mostly targeting postgraduate students), academics, and support staff. The plot below shows the diversity that was achieved in terms of race and gender.
Relevance of content: The Carpentries workshops as case study
We would like to specifically highlight contents and outcomes of Carpentries workshops since it is still not a well-known capacity development ‘tool’ in various regions in South Africa.
During the Carpentries workshops the following topics were covered:
- data collection
- data formatting
- data and file formats
- data augmentation/wrangling/manipulation
- data cleaning
- data analysis
- data visualisation
- regular expressions
- reproducible research
- open licenses for data, publications, code
- version control
- automation of repetitive tasks
- much more
The tools that were covered included:
- R
- Python
- SQL
- Github (and git)
- OpenRefine
- Spreadsheets (participants could use paid for or free spreadsheet tools)
- Linux shell
- Etherpad
It is important to note that all these tools are available for free (no license cost) to anyone in the world. This means that all participants could take what they’ve learned back to their work or home and continue to learn/do with no additional barriers of license costs. All the tools can also be implemented on any operating system on most laptops/desktops.
In RCCPII capacity development initiative we used the tools we teach:
- Github & git for website development - see our website here
- R for data analysis and visualisation - see the Shiny app here
- Python for data exploration - code not published as it was very preliminary
- Openrefine for data cleaning - scripts could not be shared as it contains information that will make participants identifiable.
- Linux for website development - when we were working with git (providing commandline access to the website files)
- Spreadsheets for data capturing - most data was captured via Google Forms and saved in Google Sheets from where it was cleaned up and analysed
- Etherpad for taking notes and facilitating interaction between presenters and participants during activities - expamples of etherpads used during the initiative is available on the eConversations page